Responsible forest management
Investors are increasingly requiring businesses to demonstrate climate action and other sustainability initiatives. Eloquent intentions and checklists of criteria watered down over negotiating tables are no longer necessarily enough – more concrete information is now demanded, for example calculations of how much carbon has successfully been sequestered, or the area of sites protected (Serafeim).
The European Union is currently debating the so-called EU Taxonomy for Sustainable Activities. This includes a requirement for all forest holdings larger than 13 ha to present a climate analysis demonstrating management compatible with climate targets and therefore eligible for funding. One would assume that the mere existence of the calculation will not suffice: it must demonstrate that the chosen management genuinely does not further harm the climate. One can predict that demands for similar analyses measuring effects on e.g. biodiversity or forest social values will soon follow.
As we know, Finland and Sweden have been doing their utmost to dispense with the new proposals (Sweden) claiming reasons that feel bogus to the outside observer. Invoked are the increased bureaucracy, and that the EU doesn’t understand how excellent Finnish and Swedish forest management already is. If this is truly the case, one wonders what exactly is to be feared from the new analyses, even if foreigners, environmental organizations or researchers don’t seem so willing to endorse the industry’s self-proclaimed excellence.
Modern forestry software calculates much more than logging volumes and timber types, including carbon balance, carbon stocks, decaying wood, recreational significance and berry crop forecasts. Climate and sustainability reporting could be integrated into normal forest management plans without bureaucracy increasing at all.
Such calculations are neutral in the sense that they are based on scientifically verified predictive models and algorithms. The calculations contain measurement-based estimates of factors influencing forests’ effects on climate, biodiversity and recreational values. The outputs cannot be watered down by political or lobbyists’ negotiations and definitions of what is supposedly “sustainable”, “renewable” or “carbon neutral” – definitions often closer to hot air than relevant information needed by the responsible investor.
I recently published research (Article) describing a method allowing comparison of the benefits to society of different forest management choices. Such benefits are also a measure of forestry’s overall responsibility and acceptability to society. The research divided forests’ products and services into four categories: timber production, biodiversity, regulatory effects and traditional forest uses such as recreation, berry and mushroom gathering, and hunting. A fifth category was ecosystem resilience, which measures the forest’s ability to recover from disturbances. Strong resilience is a measure of how likely forest products and services can be sustained long into the future.
Regulatory effects refer to forests’ effects on e.g. climate, erosion and groundwater as well as using forests to repel winds, dust and noise. One study estimated that such regulatory effects explain as much as 65-90% of forests’ current value (Kappen). Forests’ commercial use explains only 5–20 %.
Each benefit criterion was described by three indicators that can be computed for Finnish commercial forests using models and methods published in scientific literature. For example, timber production indicators were the net present value (i.e. economic profit to forest landowner from timber sales), the saw timber yield (timber available to the sawmill industry), and the pulpwood yield (timber available to the paper industry). Ecological benefits were measured by factors limiting biodiversity, namely the volume of decaying wood, the volume of aspens, and the volume of other deciduous trees.
The results were calculated separately for the southern and northern boreal regions with a 100-year forecast for four different forest management options: rotation forestry favouring conifers (i.e. clearcuts followed by replanting), rotation forestry favouring mixed stands, continuous cover forestry (i.e. avoidance of clearcuts and using natural regeneration) and any-aged forestry, which allows combinations of even-aged and continuous cover practices (Click this for longer definition). Within their respective categories, all management types were then optimised for net present value at 1, 2 and 4 per cent interest.
The value of the indicators was calculated for 10-year intervals, and their average over 100 years. The 100-year averages were then used to calculate alternative performance indices using methods developed in the decision-making sciences. The calculations assumed that the indicators’ relative significance were either unknown or random. Additionally, the benefits from different product and services were assumed non-compensatory, i.e. that all the forests’ products and services are essential, so that a complete lack of one cannot be compensated for by a high production level of one of the others.
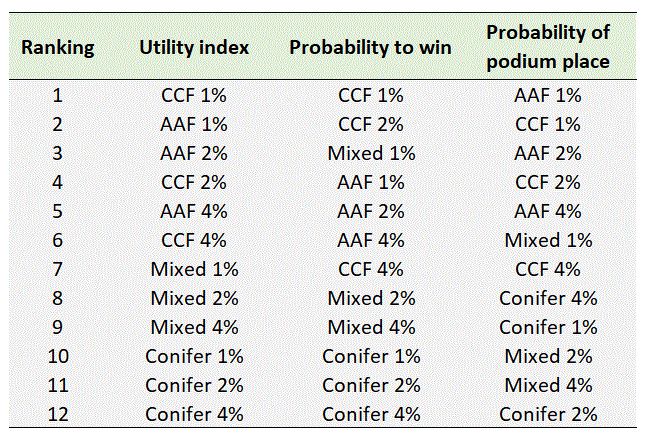
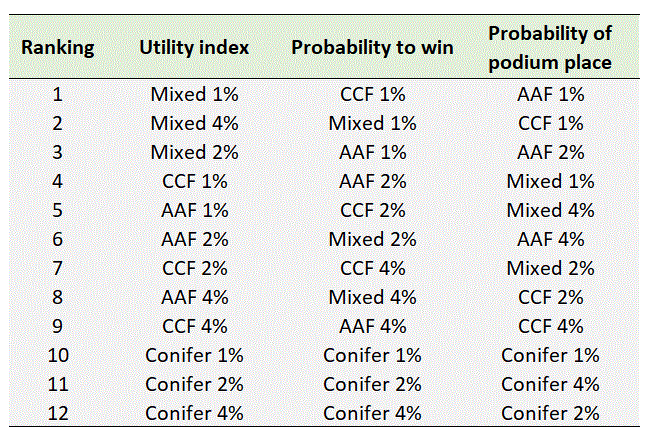
It was not surprising, at least to this author, that rotation forestry favouring conifers did poorly by comparison with the other options (Figs. 1 & 2). The benefits of forestry to society decline the larger the required interest rate of the net present value. An especially dangerous combination is a high interest requirement combined with rotation forestry favouring conifers. High interest demand leads to short rotation times and sparse forests, which in turn leads to lower timber yields, lower carbon sequestration as well as forests of little value to multiple use or biodiversity.
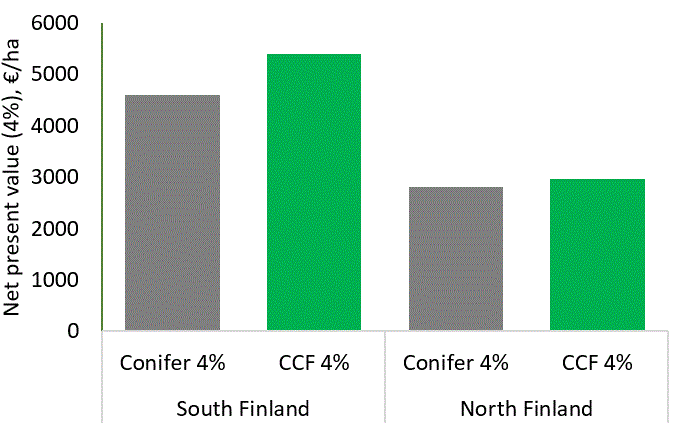
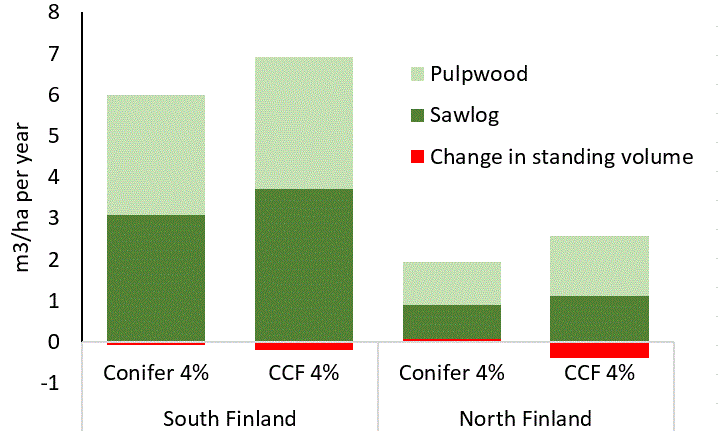
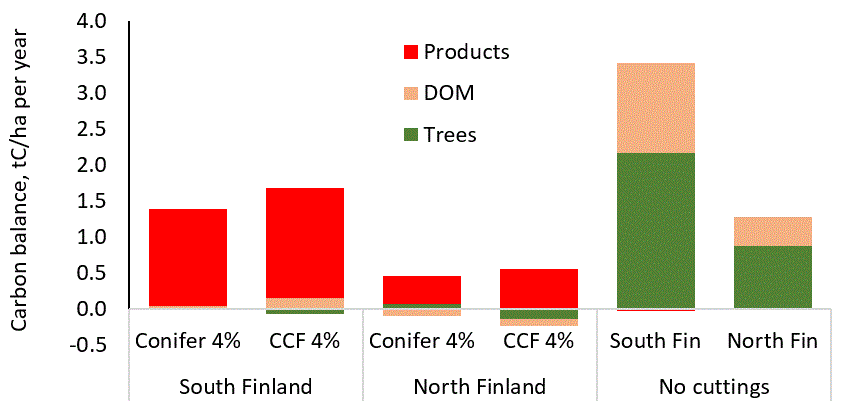
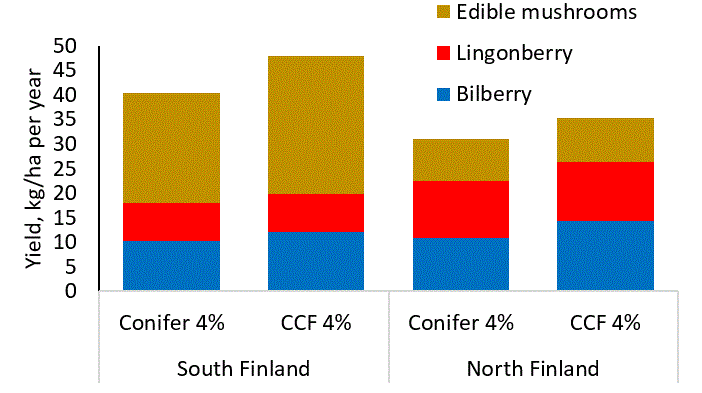
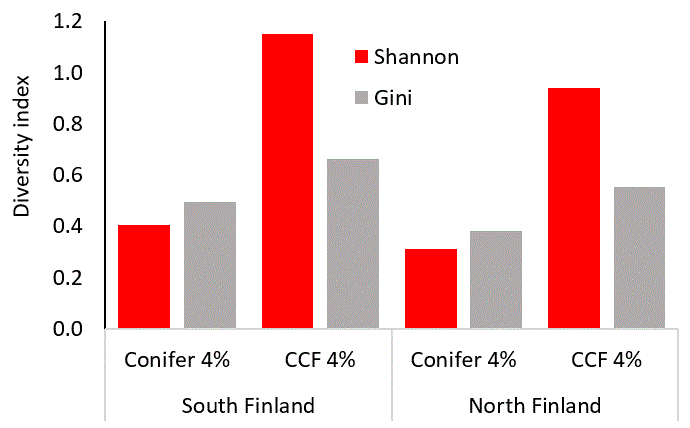
The net present value at 4% interest was better in continuous cover forestry (CCF) than in rotation forestry favouring conifers (Fig. 3). The volume of timber to industry was also better in in CCF (Fig. 4). CCF bettered rotation forestry also in carbon sequestration (Fig. 5), in mushroom and berry harvests (Fig. 6), and in terms of the mix of tree species and trunk sizes within individual stands (Fig. 7). Using a lower discount interest would improve the ability of rotation forestry to compete, and lessens the differences between it and other forest management methods.
The results did not produce any notable surprises, as the estimates of different forest management approaches on forest products and services were much the same as for earlier research results. Some parties may nonetheless find the results worrying, with various possible reactions: (1) to work all the harder to get current Finnish forest management classified in favourable categories; (2) to continue to lobby hard against climate analyses and other neutral studies; or (3) to develop forest management in such a way as to guarantee the preservation of all forest products and services.
Timo Pukkala